Goals and Objectives
The goal of this exercise is to use various geoprocessing tools to build models for sand mining suitability and impacts from sand mining in relation to the environmental and cultural risk in Trempealeau County, WI. The results of the two models will overlay to find the best locations for sand mining with minimal environmental and community impacts.Methods
The criteria for Sand Mining Suitability includes:
- Geology
- Land Use Land Cover: agricultural (herbaceous planted/cultivated) land use
- Distance to railroads
- Slope
- Water table
Each of the criteria will be ranked for suitability (3 = High, 2 = Medium, 1 = Low). Much of the criteria needed to be first transformed into rasters before they were able to be ranked by using the feature to raster tool. Table 1 takes the layers used for identifying suitability to show the rank and reason for the rank.
 |
| Table 1. Suitability ranks and reasoning for each of the criteria. |
Figure1 shows the ranks of each of the criteria for the lower Trempealeau County.
From there, the ranked rasters can be calculated in order to combine all the rasters to get a large ranking of sand mining suitability (Figure 2). The model was then multiplied by the Suitable Landcover. The ranks that were classified as 0 allowed for the ranks to solely be zero, this eliminates and clearly establishes the non-suitable sand mining.
The criteria for Sand Mining Impacts includes:
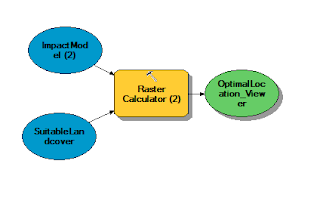
The two outputs that created the Impact Model and Suitability Model can be combined to find the optimal location for sand mining in Trempealeau County, WI (Figure 5).
By combining the two models with the raster calculator, the areas that are most recommended for sand mining based on environmental and impacts can be defined (Figure 7).
 |
| Figure 2. Model showing the ranked layers needed to be used in order to combine the rasters to get the suitability model. |
The criteria for Sand Mining Impacts includes:
- Proximity to streams
- Prime farmland
- Proximity to residential areas (noise shed and dust shed)
- Proximity to schools (noise shed and dust shed)
- Proximity to wildlife areas
Each of the criteria will be ranked for suitability (1 = High, 2 = Medium, 3 = Low). This applies mainly to the layers that were ranked based on the Natural Breaks method, shown in Table 2. This will allow for easier combining of the rasters at the end.
 |
| Table 2. Impact ranks and reasoning for each of the criteria. |
All of the criteria were based on the Natural Break method except for Prime Farmland because the attributes were defined by whether it was prime land or not for farming not numerical values (Figure 3).
 |
| Figure 3. Different ranked criteria that make up the impact model. |
The five different layers were then calculated to get the impact model using the raster calculator (Figure 4).
 |
| Figure 4. Model showing the ranked layers needed to be used in order to combine the rasters to create the impact model. |
Results and Discussion
By using the two different combining rasters (Suitability Model and Impact Model), two different rasters can be compared to see where the suitable land and most impacted land is in lower Trempealeau County (Figure 6).
 |
| Figure 6. Two models comparing the impacted land vs. the suitability land. |
 |
| Figure 7. Map that shows the areas that are optimal for sand mining. |
Conclusions
The optimal sand mining locations are in the areas that tend to be higher in the county and are farther away from streams (Figure 7). These areas are labeled in the red and orange colors. This analysis does not only show what areas can be mined, but also areas that would not bother the culture in the county. This will permit areas to be avoided so residential and developed areas are not impacted by the effects of mining.
References
Multi-Resolution Land Characteristics Consortium (MRLC). 2016. National Land Cover Database (NLCD). August 26. Accessed March 8, 2017. https://www.mrlc.gov/nlcd11_leg.php.
Natinoal Resource Conservation Service (USDA). n.d. Geospatial Data Gateway. Accessed March 6, 2017. https://datagateway.nrcs.usda.gov/GDGOrder.aspx.
Trempealeau County . 2015. Department of Land Records. Accessed March 6, 2017. http://www.tremplocounty.com/tchome/landrecords/data.aspx.
United States Department of Transportation. 2015. Bureau of Transportation Statistics. Accessed March 6, 2017. https://www.rita.dot.gov/bts/sites/rita.dot.gov.bts/files/publications/national_transportation_atlas_database/2015/polyline.
USGS. 2016. The National Map. December 16. Accessed March 6, 2017. https://nationalmap.gov/about.html.


No comments:
Post a Comment