Frac sand mining has created booming industries. Increased production for supplies as well as means of transpiration have been implemented for production, processing and distribution processes. Roughly five days a week large trucks travel over the rural roads, transporting approximately 40 million tons of sand a year from Wisconsin.
The transportation of frac sand results in great impacts on the local roads going from the mines to railroad terminals. By using network analysis, the sand from the mines to the nearest railroad terminal will be routed. The number of tips that the trucks take will then be estimated along with the cost created from the traffic on the local roads. The mines will be selected based on the following criteria:
- Must be active
- Must not have a rail loading station on-site
- Must not be within 1.5 km of a rail line
Methods
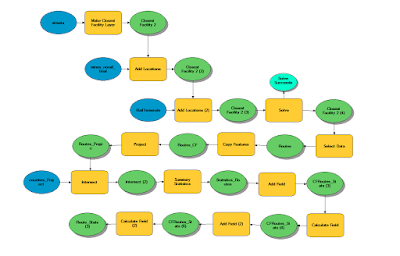
A script was completed using the criteria that was previously listed above. After the mines were selected, network analysis was used to route te sand from these mines to te rail terminals. Then the impact on the roads can be calculated. ModelBuilder is an application used to create, edit, and manage models. It shows the workflow of geoprocessing tools used. Figure 1 shows the workflow for this study. The model was used as part of the processing in selected the impacted roads. Looking at specifically the counties in Wisconsin, the route length were determined per county. That allowed for the miles to be calculated as well as the costs per year.
 |
| Figure 1. Model used to create the workflow using tools. |
Results and Discussion
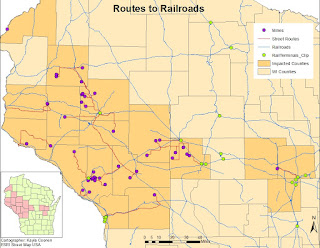
With trucks transporting to and from frac sand mines, 21 counties were affected in the state of Wisconsin. The mines selected for this study do not have a rail road attached to its property. Figure 2 highlights the impacted counties as well as heavily used streets during the transportation process.
 |
| Figure 2. Map of all the mines that do not have a rail attached to property and streets affected by transportation. |
 |
| Figure 3. Map of mines and routes in respect to rail terminals and railroads. |
 |
| Table 1. Table of hypothetical costs and number of trips taken on routes. |
 |
| Figure 4. Chart of transportation costs. |
Conclusions
Many of the frac sand mines in are located in a specific area in Wisconsin. With an industry that is still growing, the need for transportation of the resources accelerates with production. This will leave damages on the roads. It was shown that there was a relationship between roads and rail terminals. In other words, these trucks could be transporting the resources to rail terminals for the rest of the transportation process. However, this leads the county and cities within them to fix the damages of the roads. Since West Central Wisconsin is known for their sand mining, places like Chippewa, Barron, and Trempealeau county are left with a great deal of expenses.
References
ESRI street map USA
ESRI. 2016. "What is ModelBuilder?" ArcMap. Accessed April 24, 2017. http://desktop.arcgis.com/en/arcmap/latest/analyze/modelbuilder/what-is-modelbuilder.htm.
Hart, Maria V., Teresa Adams, and Andrew Schwartz. 2013. "Transportation Impacts of Frac Sand Mining in the MAFC Region: Chippewa County Case Study." White Paper Series.
No comments:
Post a Comment