Tuesday, March 14, 2017

Post 3: Data Gathering

Goals and Objectives: 
The goal of this lab is to become familiar with the process of downloading data from different sources that are available on the internet, importing the data into ArcGIS, and joining data. Lastly, being able to project that data from these different sources into one coordinate system and building and designing a geodatabase to store the data in. The data that will be obtained will be part of the multipart project in that class that will build a suitability and risk model for sand mining in Western Wisconsin. The study area for this lab focuses on Trempealeau County, WI. This lab will focus on gathering and exploring the data.

General Methods:
The data obtained for this exercise was from multiple sites. The US Department of Transportation provided the polyline data for the Railway Network. The rail line data was later clipped to only include the rail lines in Trempealeau County. On the USGS website there is a National Map Viewer. From there the National Land Cover Database (NLCD) was downloaded, specifically two data sets that included the NLCD 2011 Land cover and NLCD 2011 Percent Developed Imperviousness. Using the Multi-Resolution Land Characteristics (MRLC) site, a legend was given to describe the data. The National Map Viewer was also used to download the Elevation Products (3DEP) 1/3 arc-second DEM. Two different DEM's were needed to cover the entire Trempealeau County area. They were then created as a new raster to combine the TIFs. The USDA includes a section on their site called the Geospatial Data Gateway. Land cover can be categorized by state. Getting more specific with Trempealeau County, WI, this site had the Cropland Data by state. More land records were obtained from the Trempealeau County Land Records. The database created in the TMP downloaded data will be the workspace for the data in this lab. The last web site to gather data from was the Web Soil Survey, which is part of the USDA NRCS. This website can be zoomed not only to a specific state or county, but specific area to get the soil classification.
The SSURGO data needed to be imported in order to access the tables. By opening the folder filled with files in Access, it will import the files to be used in the TMP database. Next the component table from the Web Soil Survey database needs to be imported to the TMP database and have a relationship class, and joined.

Data Accuracy:
When there is downloaded data, the accuracy and precision are a large part of the credibility in results of ones data collection. Accuracy is the degree to which the data agrees or how close the data matches true values. Positional accuracy looks at the closeness of coordinate values in the database versus the real work. This includes the scale, effective resolution, minimum mapping unit and planimetric coordinate accuracy. The temporal accuracy is the measure of data quality in relation to the time of the creation of the data. Lastly, attribute accuracy needs to be assessed. This looks at the closeness of the descriptive data to see if the values represent the ones in the real-world. This includes metric data (DEM and TIN) or categorical data. The accuracy of the data downloaded is shown in Table 1 below.

Table 1. Accuracy of the metadata.

Geospatial Data Gateway
(USDA NRCS)
Web Soil Survey
(USDA NRCS)
Trempealeau County Department of Land Records
Bureau of Transportation Statistics
(US DOT)
Elevation:
National Map
(USGS)
Land Cover:
National Map
(USGS)
Scale
1:3998

1:4000

1:4000
1:4000
Effective Resolution
19.99

20

20
20
Minimum Mapping Unit
1.999-mm

2-mm

2-mm
2-mm
Planimetric Coordinate Accuracy
0.9996

1.0000361538

1.0000361538
1.0000361538
Temporal Accuracy
2009
2016
2000
2015
2011
2011
Attribute Accuracy (Kappa values, etc.)


Discussion and Conclusions:
After assessing the accuracy of the different data sets, a few concerns pose for the future. A main one would be the temporal accuracy. In other words, all of the data sets are from a different time. Some of them are from 2009, others 2011 or 2015. When compiling the data, some aspects could be more updated and other data sets would be outdated. This is why it is always important to use the most recent set of data, which was done for this lab. Figure 1 has a few of the layers of data. Each are from a different site. When importing the data into ArcMap, a few of the rasters and shapefiles were in different projections. This impacts the change in scale when they had to be reprojected. In the end the projection used was a County Projection Coordinate System: NAD 1983 HARN WISCRS Trempealeau County (feet). This way the county was displayed the same in each layer that only had the county showing. 
Figure 1. Different layers from the various data sets representing the structure of the land for Trempealeau County, WI. 

References: 
CP Lo, AKW Yeung - 2003 - Pearson Prentice Hall
ESRI. 2014. What is Python? March 3. Accessed March 13, 2017. http://resources.arcgis.com/en/help/main/10.2/index.html#//002z00000001000000.
Multi-Resolution Land Characteristics Consortium (MRLC). 2016. National Land Cover Database (NLCD). August 26. Accessed March 8, 2017. https://www.mrlc.gov/nlcd11_leg.php.
Natinoal Resource Conservation Service (USDA). n.d. Geospatial Data Gateway. Accessed March 6, 2017. https://datagateway.nrcs.usda.gov/GDGOrder.aspx.
NRCS (USDA). 2016. Web Soil Survery. August 10. Accessed March 6, 2017. https://websoilsurvey.sc.egov.usda.gov/App/WebSoilSurvey.aspx.
Trempealeau County . 2015. Department of Land Records. Accessed March 6, 2017. http://www.tremplocounty.com/tchome/landrecords/data.aspx.
United States Department of Transportation. 2015. Bureau of Transportation Statistics. Accessed March 6, 2017. https://www.rita.dot.gov/bts/sites/rita.dot.gov.bts/files/publications/national_transportation_atlas_database/2015/polyline.
USGS. 2016. The National Map. December 16. Accessed March 6, 2017. https://nationalmap.gov/about.html.


Post 2: Python Scripts

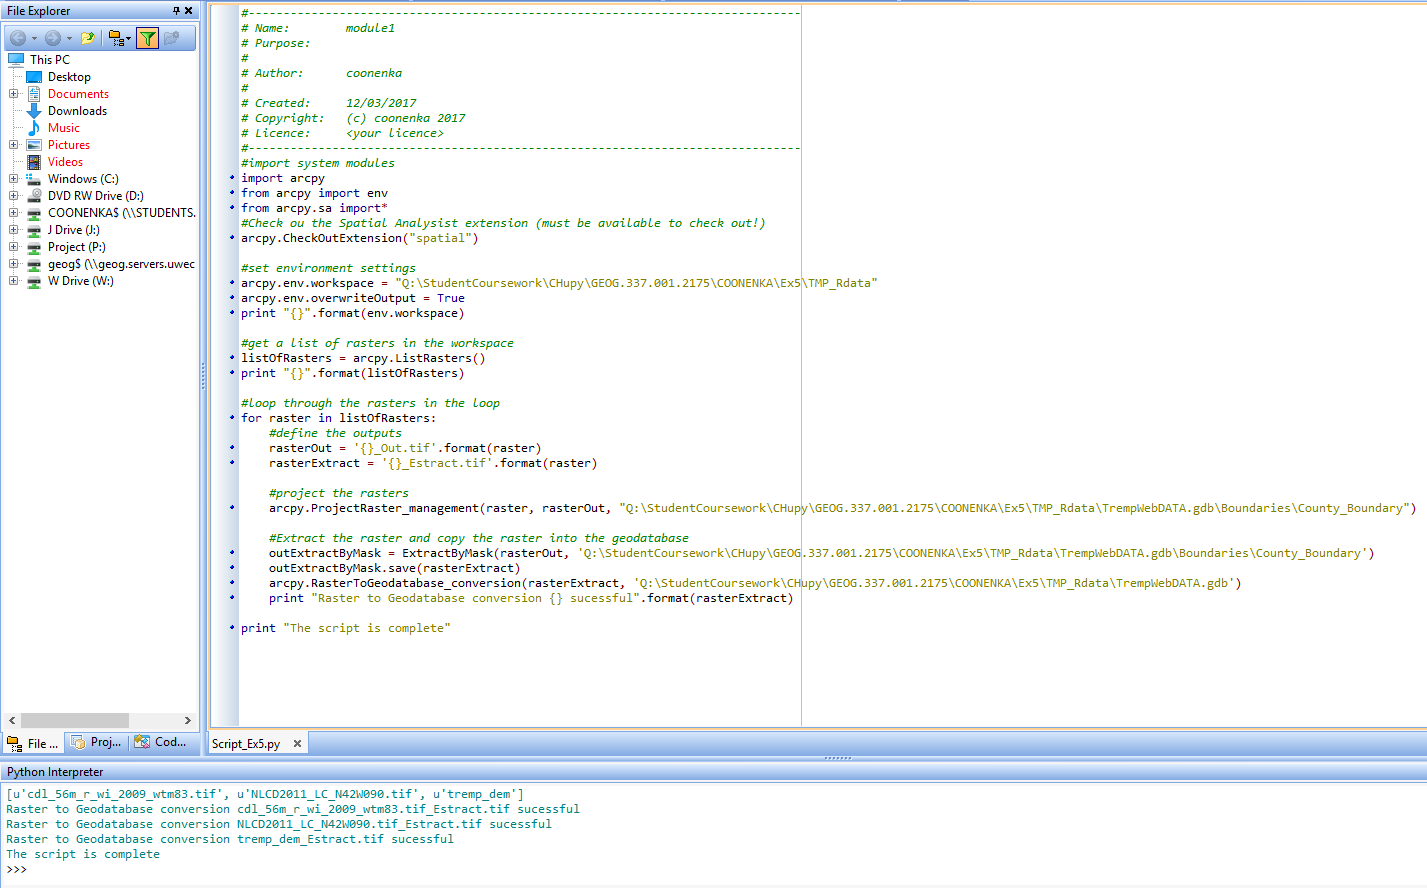
Python is a language that is used to automate computing tasks through programs called scripts. The automation makes work easier, faster, and more accurate. Python is an open source language, free, and cross-platform. ESRI has taken advantage of Python for ArcGIS. These advantages include:
  • Easy to learn and excellent for beginners, yet superb for experts
  • Highly scalable, suitable for large projects or small one-off programs known as scripts
  • Portable, cross-platform
  • Embeddable (making ArcGIS scriptable)
  • Stable and mature
  • A large user community
Python extends across ArcGIS and becomes the language for data analysis, data conversion, data management, and map automation, helping increase productivity.

 Script 1:

Script 2: 

This script will assist in the completion and use network analysis in order to calculate the impact of trucking sand from mines to rail terminals on local roads. The mines must be active and cannot have a rail loading site station on-site. The script will entail setting up the variables, writing multiple SQL statements that meet the criteria of the mines, running queries, and selecting all mines that are within km from the rail road and removing them. 


After the script was ran there was 44 mines. The results of the script were completed including new feature classes such as mines0_norail_final. However, the rails_wtm feature class did not cut to fit the state of Wisconsin. All of the rails in the continuous US are still available. That will either need to be ran again or clipped to the state of Wisconsin.

Script 3: 

This script will use various geoprocessing tools to build models for the sand mining suitability and environmental risk in Trempealeau County, WI. This specifically includes building a sand mining suitability model, a sand mining risk model, and overlaying the results to find the best locations for sand mining with minimal environmental and community impacts. 

Wednesday, February 22, 2017

Post 1: Sand Mining in Western Wisconsin Overview

What is frac sand mining? Where is it in Wisconsin?
Sand minding has been a practice in Wisconsin for over 100 years. The recent growth in the petroleum industry establish a high demand for alternative petroleum production products. This includes sand that can be used for hydraulic fracturing which involves extracting natural gas and crude oil from rock formations. Wisconsin contains a large quantity of this resource. Industrial sand is sometimes called “frac” sand or silica sand. (WI DNR 2016) Processing of the sand comprises of washing and separating the sand into grain sizes that can be capable for hydraulic fracturing. Then, the sand is shipped out for its gas and oil field uses for fracturing. The material removed during this process can be sold as a byproduct or it can also be returned to the mine site as part of the reclamation process. (WI DNR 2016) This process happens after the mining for a particular site is completed. The total number of Industrial Sand Facilities (Mines, Processing & Rail Loading) is 128; there locations are shown in Figure 1. The number of Active Facilities is 92, along with 32 Inactive Facilities, and 4 Facilities Reclaimed or are in Process of Final Reclamation. (WI DNR 2016)
Figure 1. An interactive map from the Wi DNR website that shows the locations of the mining sites.   http://dnr.wi.gov/topic/Mines/ISMMap.html (WI DNR 2016).


Frac sand is silica sand or silicon dioxide (SiO2), also referred to as quartz. Silica sand has been mined for thousands of years for its man uses such as paving roads or filtering drinking water. “It is also used in the hydrofracking process: fluid pressure fractures the rock and opens natural fractures and pores that would normally be closed due to the weight of the overlying rock, the sand grains are then carried into these fractures and prop them open after the fluid pressure is released” (Wisconsin Department of Natural Resources 2012). Not all silica sands are suitable for hydrofracking. Frac sand needs to be practically pure quarts in order to meet the industry specification. The well rounded and tight size gradation are also part of the standards. The sand needs have a high compressive strength, generally between 6,000 psi and 14,000 psi. (Wisconsin Department of Natural Resources 2012) Wisconsin has an abundant resource of sand that is derived from Quaternary glacial deposits or even marine sandstones of the Cambarian age (Figure 2), which is 500 million years ago. Sand that meet frac sand regulations found in the Cambrian include:
Figure 2. Outcrop areas of Cambrain quartz sandstones from the USGS Geologic map of the U.S. (Wisconsin Department of Natural Resources 2012).


sand regulations found in the Cambrian include: Jordan; Wonewoc; and Mt. Simon Formations; and in the younger Ordovician-age St. Peter Formation. (Wisconsin Department of Natural Resources 2012) The prominent areas for sand mining in Wisconsin are in central and western counties including: Baron, Chippewa, Trempealeau, Jackson and Monroe County (Figure 3). Baron and Chippewa  
Figure 3.  Counties in Wisconsin that contain Mining Facilities and the number of facilities in them. (US Census) (WI DNR 2016).


Counties have a higher concentration of mining Jordan Sandstone from the exposure on hilltops and Wonewac Sandstone on the lower hillsides. “A conservative estimate of Wisconsin frac sand mining capacity based on existing mines, mines under construction, and processing plants would be in excess of 12 million tons per year” (Wisconsin Department of Natural Resources 2012). In Figure 4, it shows a photograph of just one of the many mining facilities in Western Wisconsin. 
Figure 4. The sand mining facility operated by Tiller Corp. in Grantsburg, Wis., near the St. Croix River, as photographed by the Wisconsin Department of Natural Resources on April 26, 2012. (Photo courtesy Wisconsin DNR)

Issues Associated with Frac Sand Mining in Western Wisconsin
When the rock is drilled, the fractures are created by pumping in a mixture of water, chemicals, and sand. The cracks remain open while the oil and gas are released. Frac sand mining is known to generate air pollution. This is due to the emissions of tiny dust particles. It is said that is these particles are inhaled in the lungs it could lead to cancer in the lungs. This brings up the controversial issues of neighboring communities not wanting frac mines near them because of the health risks. (Earthworks 2017) Frac sand mining also constructs dangers to water sources. Miners use chemicals such as flocculants to clean, wash, or remove unwanted minerals in the sand. These chemicals can infiltrate into the groundwater. (Earthworks 2017) Because of the exposure risks, the Labor Department’s Occupational Safety and Health Administration (OSHA) issued draft regulations to reduce these health issues. (Earthworks 2017)Along with the many environmental hazards from fracking, a less known effect is the destruction of farmland in the Midwestern areas. Illinois, Wisconsin and Minnesota known to have some of the richest agricultural land. Much of this land sits on top of silica such as the St. Peter sandstone. One of the most valued silica sands in the fracking industry. By the end of 2015, there was 129 industrial sand facilities operating in Wisconsin. The New York Times comments:
“In the jargon of the fracking industry, the farmland above the sand is ‘overburden.’ Instead of growing crops that feed people, it becomes berms, walls of subsoil and topsoil piled up to 30 feet high to hide the mines” (Loeb 2016).
Mines are destroying rural communities along with farmland. The small towns are disturbed by the mine blasting, diesel trucks speeding down the rural roads, and 24-hour operations within a few hundred feet of homes and farms. (Loeb 2016)This is forcing many farmers to sell their land and move way. Those that stay have to adjust to the burden of the disturbing and polluting mines. 
With all of the new issues that have arisen due to the increased industry in frac sand mining, the WI Department of Natural Resources is working to protect the natural resources through permits, regulations and compliance. Mining companies must follow state requirements to protect public health and the environment. This includes getting necessary air and water permits from DNR and following state reclamation laws. (WI DNR 2016) The DNR uses permits to cover responsibilities to regulate air quality to control silica and fugitive dust, water permits for storm water, high capacity wells, and wetlands/surface waters (where applicable). Table 1 demonstrates the different regulation policies. 

Table 1. Permitting sand mines in Wisconsin (Hart, Adams and Schwartz 2013).
By not following the laws and regulations legal action at the state level would be reinforced. (WI DNR 2016) At the federal level, the Department of Labor’s Mine Safety and Health Administration (MSHA) enforces safety and health procedures and policies. (Hart, Adams and Schwartz 2013) After the completion of the mining process, a reclamation plan must be finalized using Wisconsin Administrative Code NR135. Alternative land uses are constructed then to the old site. Potential land uses include green spaces, wildlife habitats, agriculture, or lakes and ponds. Many of these decisions for the new land use options are influenced by the local and county governments. 

References 
Earthworks. 2017. Frac Sand Health and Environmental Impacts. Accessed February 22, 2017. https://www.earthworksaction.org/issues/detail/frac_sand_health_and_environmental_impacts#.WK3TrjsrKM9.
Hart, Maria V., Teresa Adams, and Andrew Schwartz. 2013. "Transportation Impacts of Frac Sand Mining in MAFC Region: Chippewa County Case Study." Mid-America Feight Coalition. Accessed February 20, 2016. http://midamericafreight.org/wp-content/uploads/FracSandWhitePaperDRAFT.pdf.
Loeb, Nancy C. 2016. "The Sand Mines that Ruin Farmland." NY Times. May 23. Accessed February 22, 2017. https://www.nytimes.com/2016/05/23/opinion/the-sand-mines-that-ruin-farmland.html?_r=0.
US Census Bureau. 2017. American Fact Finder. Accessed February 20, 2017. https://factfinder.census.gov/faces/nav/jsf/pages/searchresults.xhtml?refresh=t.
WI DNR. 2016. "Industrial sand mining overview." WI DNR. July 5. Accessed February 20, 2017. http://dnr.wi.gov/topic/Mines/Sand.html.
Wisconsin Department of Natural Resources. 2012. "Silica Sand Mining in Wisconsin." Wi DNR. January. Accessed February 20, 2017. http://dnr.wi.gov/topic/Mines/documents/SilicaSandMiningFinal.pdf.