Monday, April 24, 2017

Post 5: Network Analysis

Goals and Objectives
Frac sand mining has created booming industries. Increased production for supplies as well as means of transpiration have been implemented for production, processing and distribution processes. Roughly five days a week large trucks travel over the rural roads, transporting approximately 40 million tons of sand a year from Wisconsin.

The transportation of frac sand results in great impacts on the local roads going from the mines to railroad terminals. By using network analysis, the sand from the mines to the nearest railroad terminal will be routed. The number of tips that the trucks take will then be estimated along with the cost created from the traffic on the local roads. The mines will be selected based on the following criteria:
  • Must be active
  • Must not have a rail loading station on-site
  • Must not be within 1.5 km of a rail line

Methods
A script was completed using the criteria that was previously listed above. After the mines were selected, network analysis was used to route te sand from these mines to te rail terminals. Then the impact on the roads can be calculated. ModelBuilder is an application used to create, edit, and manage models. It shows the workflow of geoprocessing tools used. Figure 1 shows the workflow for this study. The model was used as part of the processing in selected the impacted roads. Looking at specifically the counties in Wisconsin, the route length were determined per county. That allowed for the miles to be calculated as well as the costs per year.
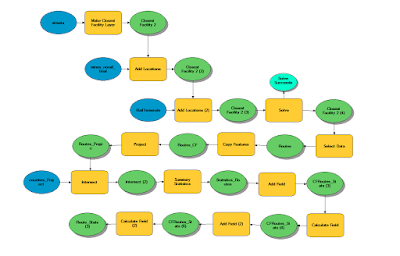
Figure 1. Model used to create the workflow using tools.

Results and Discussion 
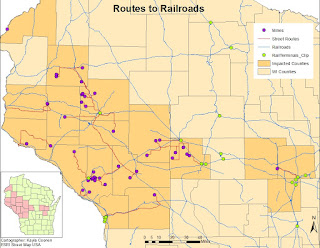
With trucks transporting to and from frac sand mines, 21 counties were affected in the state of Wisconsin. The mines selected for this study do not have a rail road attached to its property. Figure 2 highlights the impacted counties as well as heavily used streets during the transportation process.
Figure 2. Map of all the mines that do not have a rail attached to property and streets affected by transportation.
Figure 3 also looks at how the routes could be used to potentially be transported to rail terminals.To reduce the impact of trucks driving on particular roads, these trucks could be bringing the resources to a rail terminal for the rest of the transportation process. In many cases, the routes from the mines linked to rail terminals.
Figure 3. Map of mines and routes in respect to rail terminals and railroads.
After assessing which counties were impacted by transportation, routes were selected by which were the most prominent. The length of the route was then determined by county. Table 1 shows the hypothetical costs that could be associated with each county for potential upkeep and repairs to the county roads. It was assumed that each sand mine 50 truck trips per year to the rail terminal. The truck has to return to the sand mine, so that number needs to be doubled to account for there and back. The hypothetical cost was estimated to be 2.2 cents per mile. Looking again at Table 1, Chippewa County will have the most estimated costs for roads at $726.30 per year.  Barron, Wood and Trempealeau County are next in line for the high expenses in Wisconsin.
Table 1. Table of hypothetical costs and number of trips taken on routes.
To break down the costs even more, Figure 4 shows a linear model of the transportation costs. The equation of the slope is defined as y = 2.2x + 0.000004. Many of the counties have predicted costs on the lower end. Chippewa County is the high outlier, with higher costs, Barron County in the middle of the trend line, and Wood and Trempealeau following behind it.
Figure 4. Chart of transportation costs.


Conclusions
Many of the frac sand mines in are located in a specific area in Wisconsin. With an industry that is still growing, the need for transportation of the resources accelerates with production. This will leave damages on the roads. It was shown that there was a relationship between roads and rail terminals. In other words, these trucks could be transporting the resources to rail terminals for the rest of the transportation process. However, this leads the county and cities within them to fix the damages of the roads. Since West Central Wisconsin is known for their sand mining, places like Chippewa, Barron, and Trempealeau county are left with a great deal of expenses.

References
ESRI street map USA
ESRI. 2016. "What is ModelBuilder?" ArcMap. Accessed April 24, 2017.    http://desktop.arcgis.com/en/arcmap/latest/analyze/modelbuilder/what-is-modelbuilder.htm.
Hart, Maria V., Teresa Adams, and Andrew Schwartz. 2013. "Transportation Impacts of Frac Sand  Mining in the MAFC Region: Chippewa County Case Study." White Paper Series.

Monday, April 10, 2017

Post 4: Geocoding


Goals and Objectives
The goal of this lab is to geocode locations of sand mines in Wisconsin. The mines are divided up into among the class, so the results can be compared in terms of potential error. The objectives include normalizing the data of the mines in excel, geocode the mines using the geocoding service from ESRI, using the Public Land Survey System (PLSS) to assist with geocoding, and compare the results with geocoded mines from other colleagues.

Methods
With the 19 mines that were assigned, they each had to be geocoded. Using the data from the WI DNR, addresses and PLSS were attached to each mine information. However, some mines just had the address and some only had a PLSS. The first step was using the geocoding service from ESRI in ArcMap. From there, each location was checked to make sure that the point was not placed in a reference area to the city, but the actual mine itself. The points were rematched manually, if they were not located in front of a mine. Once the address points were relocated, the locations that were unclear or only had a PLSS, were referenced with the PLSS provided from the WI DNR shapefile to find the rest of the error in the locations.

Results
The data of the mines needed to be normalized in order to the geocoding service in ArcMap to correctly operate. Table 1 is a fraction of the data that was assigned before it was normalized. In this table, a few attributes were missing.
Table 1. Part of the data and its attributes before it was normalized.
Table 2 demonstrates how the data table was then normalized by adding a few fields. This included creating a separate PLSS, Street Address, Street, State, City, and Zip code fields.
Table 2. Part of the data and its attributes after it was normalized.
After geocoding and rematching the locations of the mines, the locations were created in a new feature class (Figure 1).
Figure 1. Geocoded and PLSS identified Mine Locations.
The mines were then compared to two different sets of data. The first being another colleagues geocoded mines. One colleague had 14 of the same mines, so 14 of the 19 mines were compared (Figure 2). Using the Generate Near Table tool, a table was created by inputting the two sets of data to compare the distance (meters) between the geocoded mines. This allowed for recognition in error of the sets of data.
Figure 2. Comparison of the geocoded mines with the mines that were geocoded by another colleague.
The Generate Near Table tool was used again to compare the geocoded mine locations with the actual locations of the selected mines (Figure 3).
Figure 3. Geocoded locations in comparison to the Actual Locations of the mines.


Discussion 
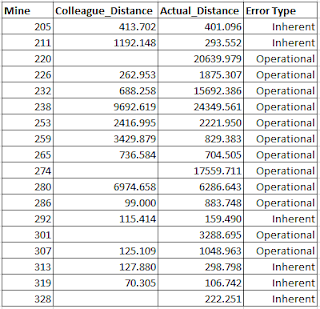
The distance tables were used to select the error type and detect the error in the geocoding process. According to Lo, there is two types of error: inherent and operational. Inherent error is defined as errors that occur as a result of the real world data (Lo 2003). There could be potential changes in scale or variations when projecting the data. Operational data is classified as error that happens during data collections and managing (Lo 2003). It can also be simply referred to as user or processing errors. Looking at Table 3, majority of the error types are operational. The wrong mines could be have been chosen around the reference point as well as misreading the PLSS or addresses. The error in the geocoded locations can be recognized in Figure 3 due to the fact that every point does not line up.
Table 3. Table of showing error of geocoded mines in comparison to the actual mines.
The error types that were identified as inherent were most likely influenced by the where the mine location is defined. The points that were geocoded were placed at the entrances of the mines, closer to the streets. This is different from the actual locations that placed the points in the middle of the mines, that are not necessarily close to the streets or entrances of the mines.

Conclusion
In the beginning of the geocoding process, the ESRI service stated that 19 of the 19 locations has been matched. Based on the information provided in the data tables, matching in ArcMap does not mean it is necessarily in the exact location of the mines. The data points need to be checked to make sure they are actually located in their destined location. Even then, operational errors can be made by not referencing the right PLSS locations or reading the correct addresses. Often times cities have more than one mine, so the point could have been placed in front of the mine, but not the right one. Looking at the error table, there are points that have a great distance between them and the actual locations. This is why it is important to look at the error in the data. Editing could  be done at a later time to replace the points in the correct locations and lower the chance of error and adjust mistakes.

References
CP Lo, AKW Yeung - 2003 - Pearson Prentice Hall